
Published on : December 23, 2022
An increase in the average hourly rates in the Canadian labour market. Job vacancies remain high in the third quarter of 2022.
On December 19, 2022, Statistics Canada released the latest findings based on the Job Vacancy and Wage Survey (JVWS). The latest 2022 Q3 Statistics Canada report suggests a dynamic hiring climate. As per the latest findings, “Employers in Canada were actively seeking to fill 959,600 vacant positions in the third quarter …”
Overall, the total number of job vacancies in Canada in the third quarter remained high. The data is released on a quarterly basis.
Provinces in Canada with the highest job vacancy rate continued to be -
The trend of there being the most job vacancies in British Columbia and Quebec has continued since the second quarter of 2019.
Among the provinces, the number of vacancies increased the highest in -
New record high vacancies in health care
Job vacancies in healthcare and social assistance increased to an all-time record high of 150,100 jobs in 2022 Q3, registering an increase of 9.5% (+13,000). The total labour demand in the sector also went up, resulting in a significant year-over-year increase.
Job vacancies rose in the third quarter for -
Together, these three occupations made up a majority of all vacancies in health occupations in the third quarter of 2022. Health occupations had the highest proportion of long-term vacancies in both 2020 Q1 as well as 2022 Q3.
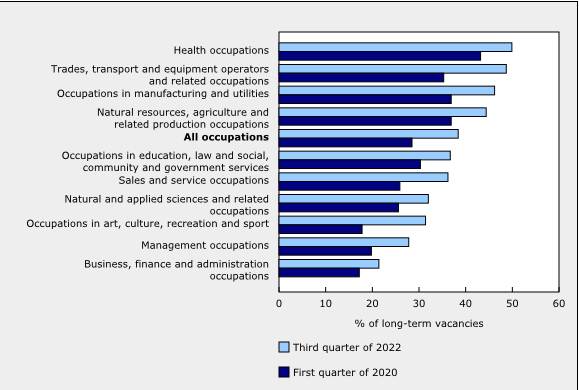
Source: Statistics Canada, Job Vacancy and Wage Survey (5217), table 14-10-0328-01.
As per Statistics Canada, “offered wages increase markedly in 10 of 40 broad occupation groups”. Dealing with hiring difficulties and a tight labour market, some employers have hiked the offered wages.
Compared to 2021 Q3, the average offered hourly wages increased by 7.5% to CAD 24.20 (INR 1,471 approx.) in the third quarter of 2022. The average hourly wages of all employees increased by 5.3% over the same period.
10 of the 40 broad NOC groups registered an increase in the average offered hourly wages in 2022 Q3 that either matched or exceeded the national average.
|
The 10 occupations with the largest annual increases in job vacancies and their average offered wage, third quarter of 2022 |
||||||
|
Number of job vacancies |
Change in Level |
Percentage change |
Average offered hourly wage |
|||
|
Third quarter 2021 |
Third quarter 2022 |
Year-over-year change |
Third quarter 2021 |
Third quarter 2022 |
||
|
Registered nurses and registered psychiatric nurses |
22,805 |
27,595 |
4,790 |
21.0% |
CAD 31.85 (INR 1,936 approx.) |
CAD 33.20 (INR 2,018 approx.) |
|
Retail salespersons |
43,495 |
47,725 |
4,230 |
9.7% |
CAD 15.30 (INR 930 approx.) |
CAD 15.95 (INR approx.) |
|
Transport truck drivers |
22,990 |
26,905 |
3,915 |
17.0% |
CAD 24.80 (INR approx. 1,507) |
CAD 27.55 (INR 1,675 approx.) |
|
Early childhood educators and assistants |
7,835 |
11,700 |
3,865 |
49.3% |
CAD 18.45 (INR 1,122 approx.) |
CAD 19.55 (INR 1,189 approx. ) |
|
Automotive service technicians, truck and bus mechanics and mechanical repairers |
6,335 |
10,055 |
3,720 |
58.7% |
CAD 26.15 (INR 1,590 approx.) |
CAD 27.85 (INR 1,693 approx.) |
|
Social and community service workers |
11,400 |
14,995 |
3,595 |
31.5% |
CAD 21.00 (INR 1,277.approx.) |
CAD 22.00 (INR 1,337 approx.) |
|
Food counter attendants, kitchen helpers and related support occupations |
70,410 |
73,745 |
3,335 |
4.7% |
CAD 14.85 (INR 903 approx.) |
CAD 15.50 (INR 942 approx.) |
|
Other customer and information services representatives |
16,270 |
19,405 |
3,135 |
19.3 |
CAD 18.20 (INR 1,106 approx.) |
CAD 19.20 (INR 1,167 approx.) |
|
Licensed practical nurses |
10,140 |
13,050 |
2,910 |
28.7 |
CAD 26.35 (INR1,602 approx.) |
CAD 27.25 (INR 1,657 approx.) |
|
Construction trades helpers and labourers |
22,325 |
25,200 |
2,875 |
12.9 |
CAD 21.40 (INR 1,301 approx.) |
CAD 22.45 (INR 1,365 approx.) |
Source: Statistics Canada, Job Vacancy and Wage Survey (5217), table 14-10-0356-01.
The previous data was released on September 20, 2022. Data on the job vacancies for the fourth quarter of 2022 is scheduled to be released on March 21, 2023.
The Survey provides comprehensive information on -
Occupation details are provided for Canada in general and for the provinces, territories, and economic regions.
Canada needs immigrants to sustain the Canadian labour market and grow the economy. 465,000 individuals - including principal applicants and their dependents - will get Canadian permanent residence in 2023. Express Entry is the most popular route to get Canada PR.
For eligibility evaluation, get in touch today!
Topics: Canada
![]()
![]()
![]()


